System Dynamics is a computer-aided approach to understand the behavior of complex systems over time. It is a well-known method for analyzing production distribution systems because complex systems could be modeled effectively over time. It consists of internal feedback and time delays that affect the behavior of the system. Jay W. Forrester at the Massachusetts Institute of Technology had initially developed the field named as "Industrial Dynamics" (Forrester 1961). System Dynamics has its origins in control engineering and management; the approach uses a perspective based on information feedback and delays to understand the dynamic behavior of complex physical, biological, and social systems. Forrester (1961) defines Industrial Dynamics as "... the study of the information feedback characteristics of industrial activity to show how organizational structure, amplification (in policies), and time delays (in decision and actions) interact to influence the success of the enterprise. It treats the interactions between the flows of information, money, orders, materials, personnel, and capital equipment in a company, an industry, or a national economy…". Feedback, accumulation of flows into stocks and time delays are various elements of system dynamics.
System dynamics is dealing with the value of states in a system over time. For example, you think a city as a system and we simplify the states inside the city only to consider the population of the city over time.
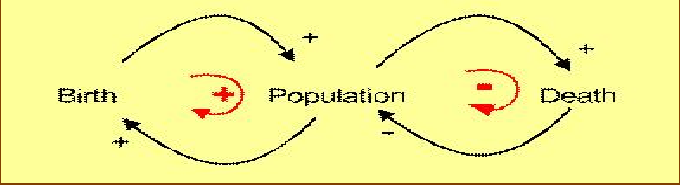
Causal loop diagram shows only the causal relationship of the level and rates in a system. The number of baby birth in the city causes increase in population and higher number of population causes higher number of birth. This part of loop is called positive feedback loop as shown in red. The number of people who die in the city is a function of population. Higher the number of population, higher the number of death people. However, higher the numbers of death peoples in the city will effect into reduce the number of population. This part of loop is called negative feedback loop.
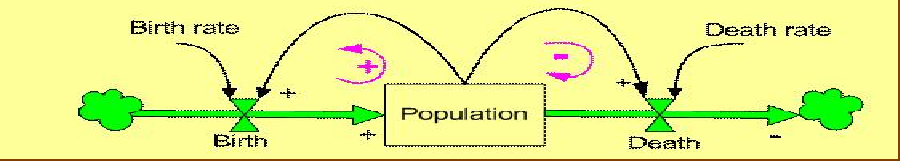
Stock and flow diagram shows the relationship of the level and rates and constants in a system.