

Modeling UML Class Diagrams and Sequence diagrams
Developing a software system in object oriented approach is very much dependent on understanding the problem. Some aspects and the respective models are used to describe problems and in context of those aspects the respective models give a clear idea regarding the problem to a designer. For developer, structural and behavioral aspects are two key aspects to see through a problem to design a solution for the same.
It is a graphical representation for describing a system in context of its static construction.
Class diagram contains the system classes with its data members, operations and relationships between classes.
A set of objects containing similar data members and member functions is described by a class. In UML syntax, class is identified by solid outline rectangle with three compartments which contain
Class name A class is uniquely identified in a system by its name. A textual string is taken as class name. It lies in the first compartment in class rectangle.
Attributes Property shared by all instances of a class. It lies in the second compartment in class rectangle.
Operations An execution of an action can be performed for any object of a class. It lies in the last compartment in class rectangle.
To build a structural model for an Educational Organization, ‘Course’ can be treated as a class which contains attributes ‘courseName’ & ‘courseID’ with the operations ‘addCourse()’ & ‘removeCourse()’ allowed to be performed for any object to that class.
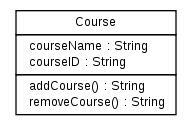
Figure - 1
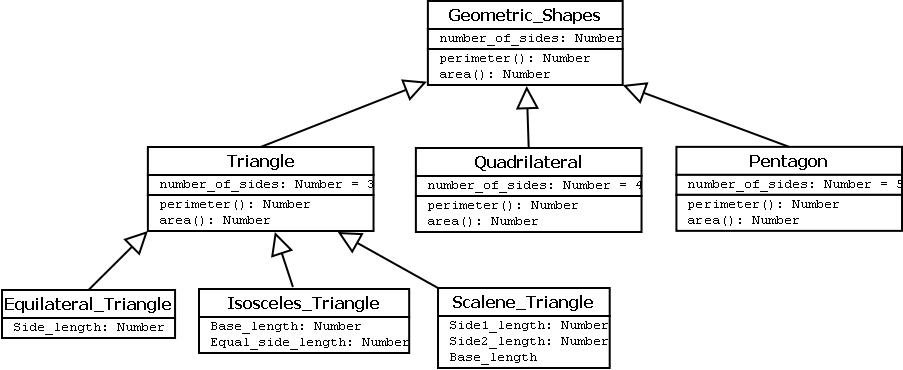
Figure - 2
Geometric_Shapes is the class that describes how many sides a particular shape has. Triangle, Quadrilateral and Pentagon are the classes that inherit the property of the Geometric_Shapes class. So the relations among these classes are generalization. Now Equilateral_Triangle, Isosceles_Triangle and Scalene_Triangle, all these three classes inherit the properties of Triangle class as each one of them has three sides. So, these are specialization of Triangle class.
Existing relationships in a system describe legitimate connections between the classes in that system.
In structure model for a system of an organization an employee (instance of ‘Employee’ class) is always assigned to a particular department (instance of ‘Department’ class) and the association can be shown by a line connecting the respective classes.
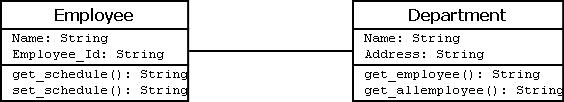
Figure - 3
For a supermarket in a city, each branch runs some of the departments they have. So, the relation among the classes ‘Branch’ and ‘Department’ can be designed as an aggregation. In UML, it can be shown as in the fig. below
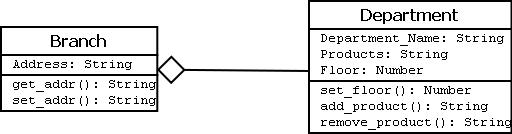
Figure - 4
-Composition
It is a strong from of aggregation which describes that whole is completely owns its part. Life cycle of the part depends on the whole.
Let consider a shopping mall has several branches in different locations in a city. The existence of branches completely depends on the shopping mall as if it is not exist any branch of it will no longer exists in the city. This relation can be described as composition and can be shown as below
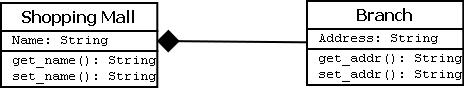
Figure - 5
-**Multiplicity **
It describes how many numbers of instances of one class is related to the number of instances of another class in an association.
| Instance | Multiplicity |
|---|---|
| Single instance | 1 |
| Zero or one instance | 0..1 |
| Zero or more instance | 0..* |
| One or more instance | 1..* |
| Particular range (two to six) | 2..6 |
One vehicle may have two or more wheels
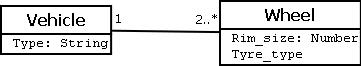
Figure - 6
It represents the behavioral aspects of a system. Sequence diagram shows the interactions between the objects by means of passing messages from one object to another with respect to time in a system.
Sequence diagram contains the objects of a system and their life-line bar and the messages passing between them.
Objects appear at the top portion of sequence diagram. Object is shown in a rectangle box. Name of object precedes a colon ‘:’ and the class name, from which the object is instantiated. The whole string is underlined and appears in a rectangle box. Also, we may use only class name or only instance name.
Objects which are created at the time of execution of use case and are involved in message passing , are appear in diagram, at the point of their creation.
A down-ward vertical line from object-box is shown as the life-line of the object. A rectangle bar on life-line indicates that it is active at that point of time.
Messages are shown as an arrow from the life-line of sender object to the life-line of receiver object and labeled with the message name. Chronological order of the messages passing throughout the objects’ life-line show the sequence in which they occur. There may exist some different types of messages :
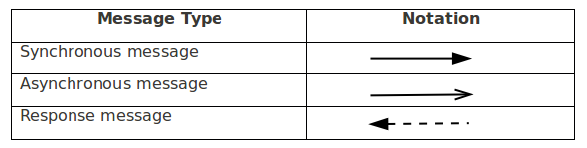
Figure - 7