
CRITICAL FLASH OVER OF A SPHERE GAP USING IVG
SET PARAMETER VALUES:
Sphere Diameter: cm
Sphere Gap: cm
Voltage/Stage: kV
OBSERVATION TABLE
Temperature: ℃
Humidity:
Pressure: mb
| Voltage Level / Stage (kV) | Pulse No. | Probability of Flashover | |||||||||
|---|---|---|---|---|---|---|---|---|---|---|---|
| 1 | 2 | 3 | 4 | 5 | 6 | 7 | 8 | 9 | 10 | ||
* F - Flashover
* W - Withstand
Voltage for 50% flashover:
PROBABILITY - VOLTAGE LEVEL CURVE
>
SIMULATOR
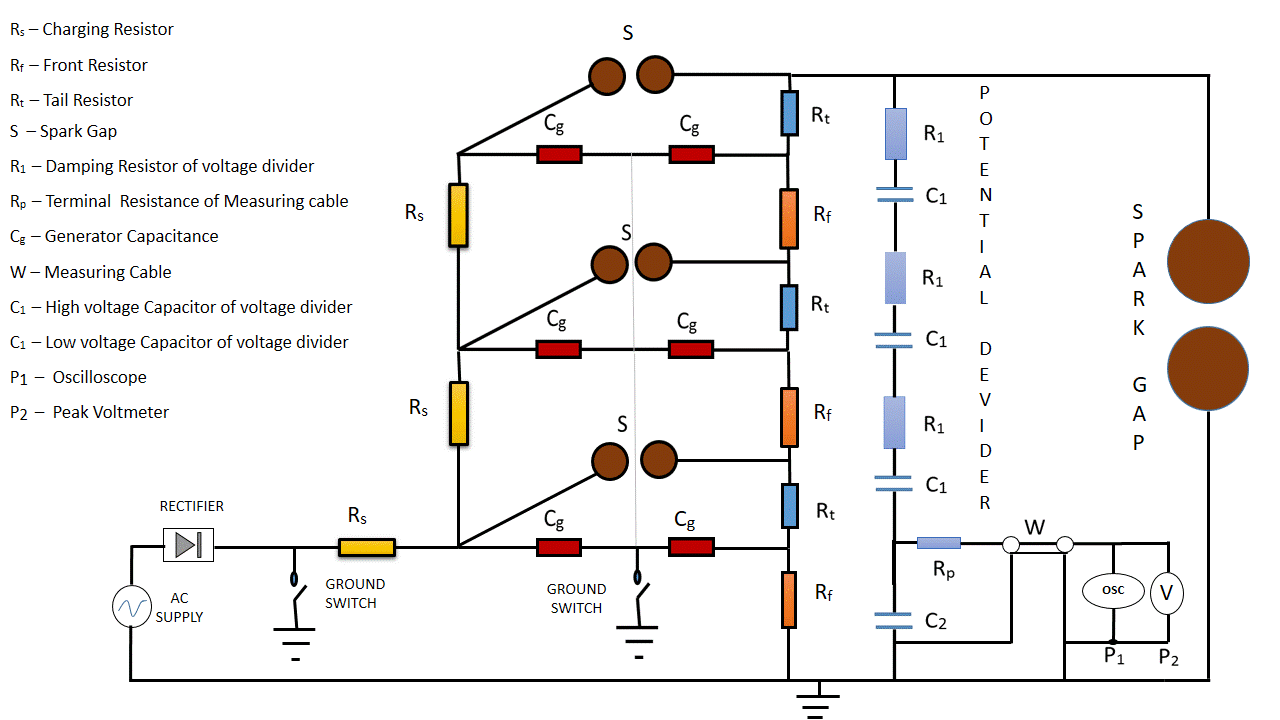
EQUIVALENT CIRCUIT DIAGRAM

INSTRUCTIONS
- When the page gets loaded the value of Diameter of the sphere should be choosen from the displayed dropdown box.
- After choosing the value of sphere diameter wait for some time until the temperature, pressure and humidity are updated which are given in observation table
- The sphere gap distance values gets populated in response to the selected sphere diameter in another drop down and one of the value should be selected.
- The voltage level values per stage gets populated in response to the selected sphere gap in another drop down and one of the value should be selected.
- Start experiment button is clicked to start experiment
- The Trigger generator button is to be clicked to display the mechanism of IVG and the fact that Breakdown has occurred or not is displayed.
- The fill table button is to be clicked to fill data into observation table.
- Procedure 4,5,6 have to repeat 10 times for selected voltage level and The Break-down probability for each voltage level is calculated as Number of pulses break-down divided by Total Number of pulses.
- Steps 4,5 & 6 are repeated for all applied voltage values to complete the Experiment.
- The plot button will be enabled at the end of the experiment.
- The button is to be clicked to display the variation of the Applied Voltage versus the Breakdown probability.
- The critical flash over voltage value (for given sphere diameter and gap spacing) namely the voltage value for 50% probability of breakdown is displayed prominently on the graph.
CHARACTERISTICS
Copyright © 2011 Indian Institute of Technology Kharagpur,
Licensing Terms