

The complete cycle takes two revolutions divided into four equal strokes. It is known that in a four stroke cycle SI engine, there is one working stroke or power stroke (i.e., shown as blue point).
Since the pressure inside the engine cylinder is less than the atmospheric pressure during suction stroke, therefore negative loop (0-pi crank angle) is formed (as shown in crank angle 0-pi). During compression stroke, the work is done on the gasses therefore, negative loop is obtained. During expansion or cracking stroke, the fuel burns and gases (air-fuel mixture) expand therefore large positive loop is formed. During exhaust stroke, the work is done on the gases, therefore negative loop is formed (3pi-4pi) crank angle.
Consider a graph of torque against crank angle for a typical 4 stroke engine:
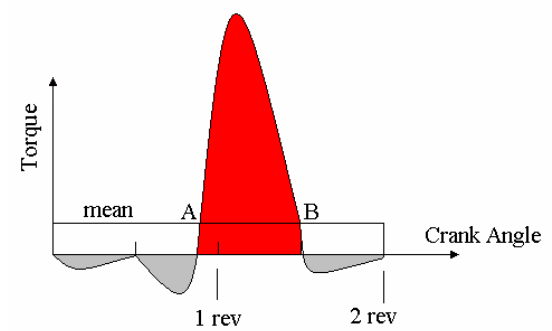
The complete cycle takes two revolutions divided into four equal strokes. One revolution is 2pi radians so it takes 4pi radians to complete the cycle. Only the red part of the diagram represents energy given out (the power stroke). The induction, compression and exhaust strokes require negative torque as energy is required to do these. If the machine is to be a successful engine, the area of the red part must be larger than the areas of the grey parts giving a positive mean torque. The area above and below the mean line must be equal by definition of mean. The area of the rectangle formed between the mean and zero must be the work output of the engine per cycle.
We know that,
Torque = Work done by the engine/crank angle
Work done by the cycle = Integration of `P.dV`
The total work done is angle x torque so in this case we have:
`W = T_(mean).4.pi`
Note that the angle is not always `4pi` but whatever angle corresponds to the cycle. For example it would be `2pi` for a 2 stroke engine.


To measure and plot the torque crank angle curve diagram as a function of crank position for a four stroke single cylinder SI engine.

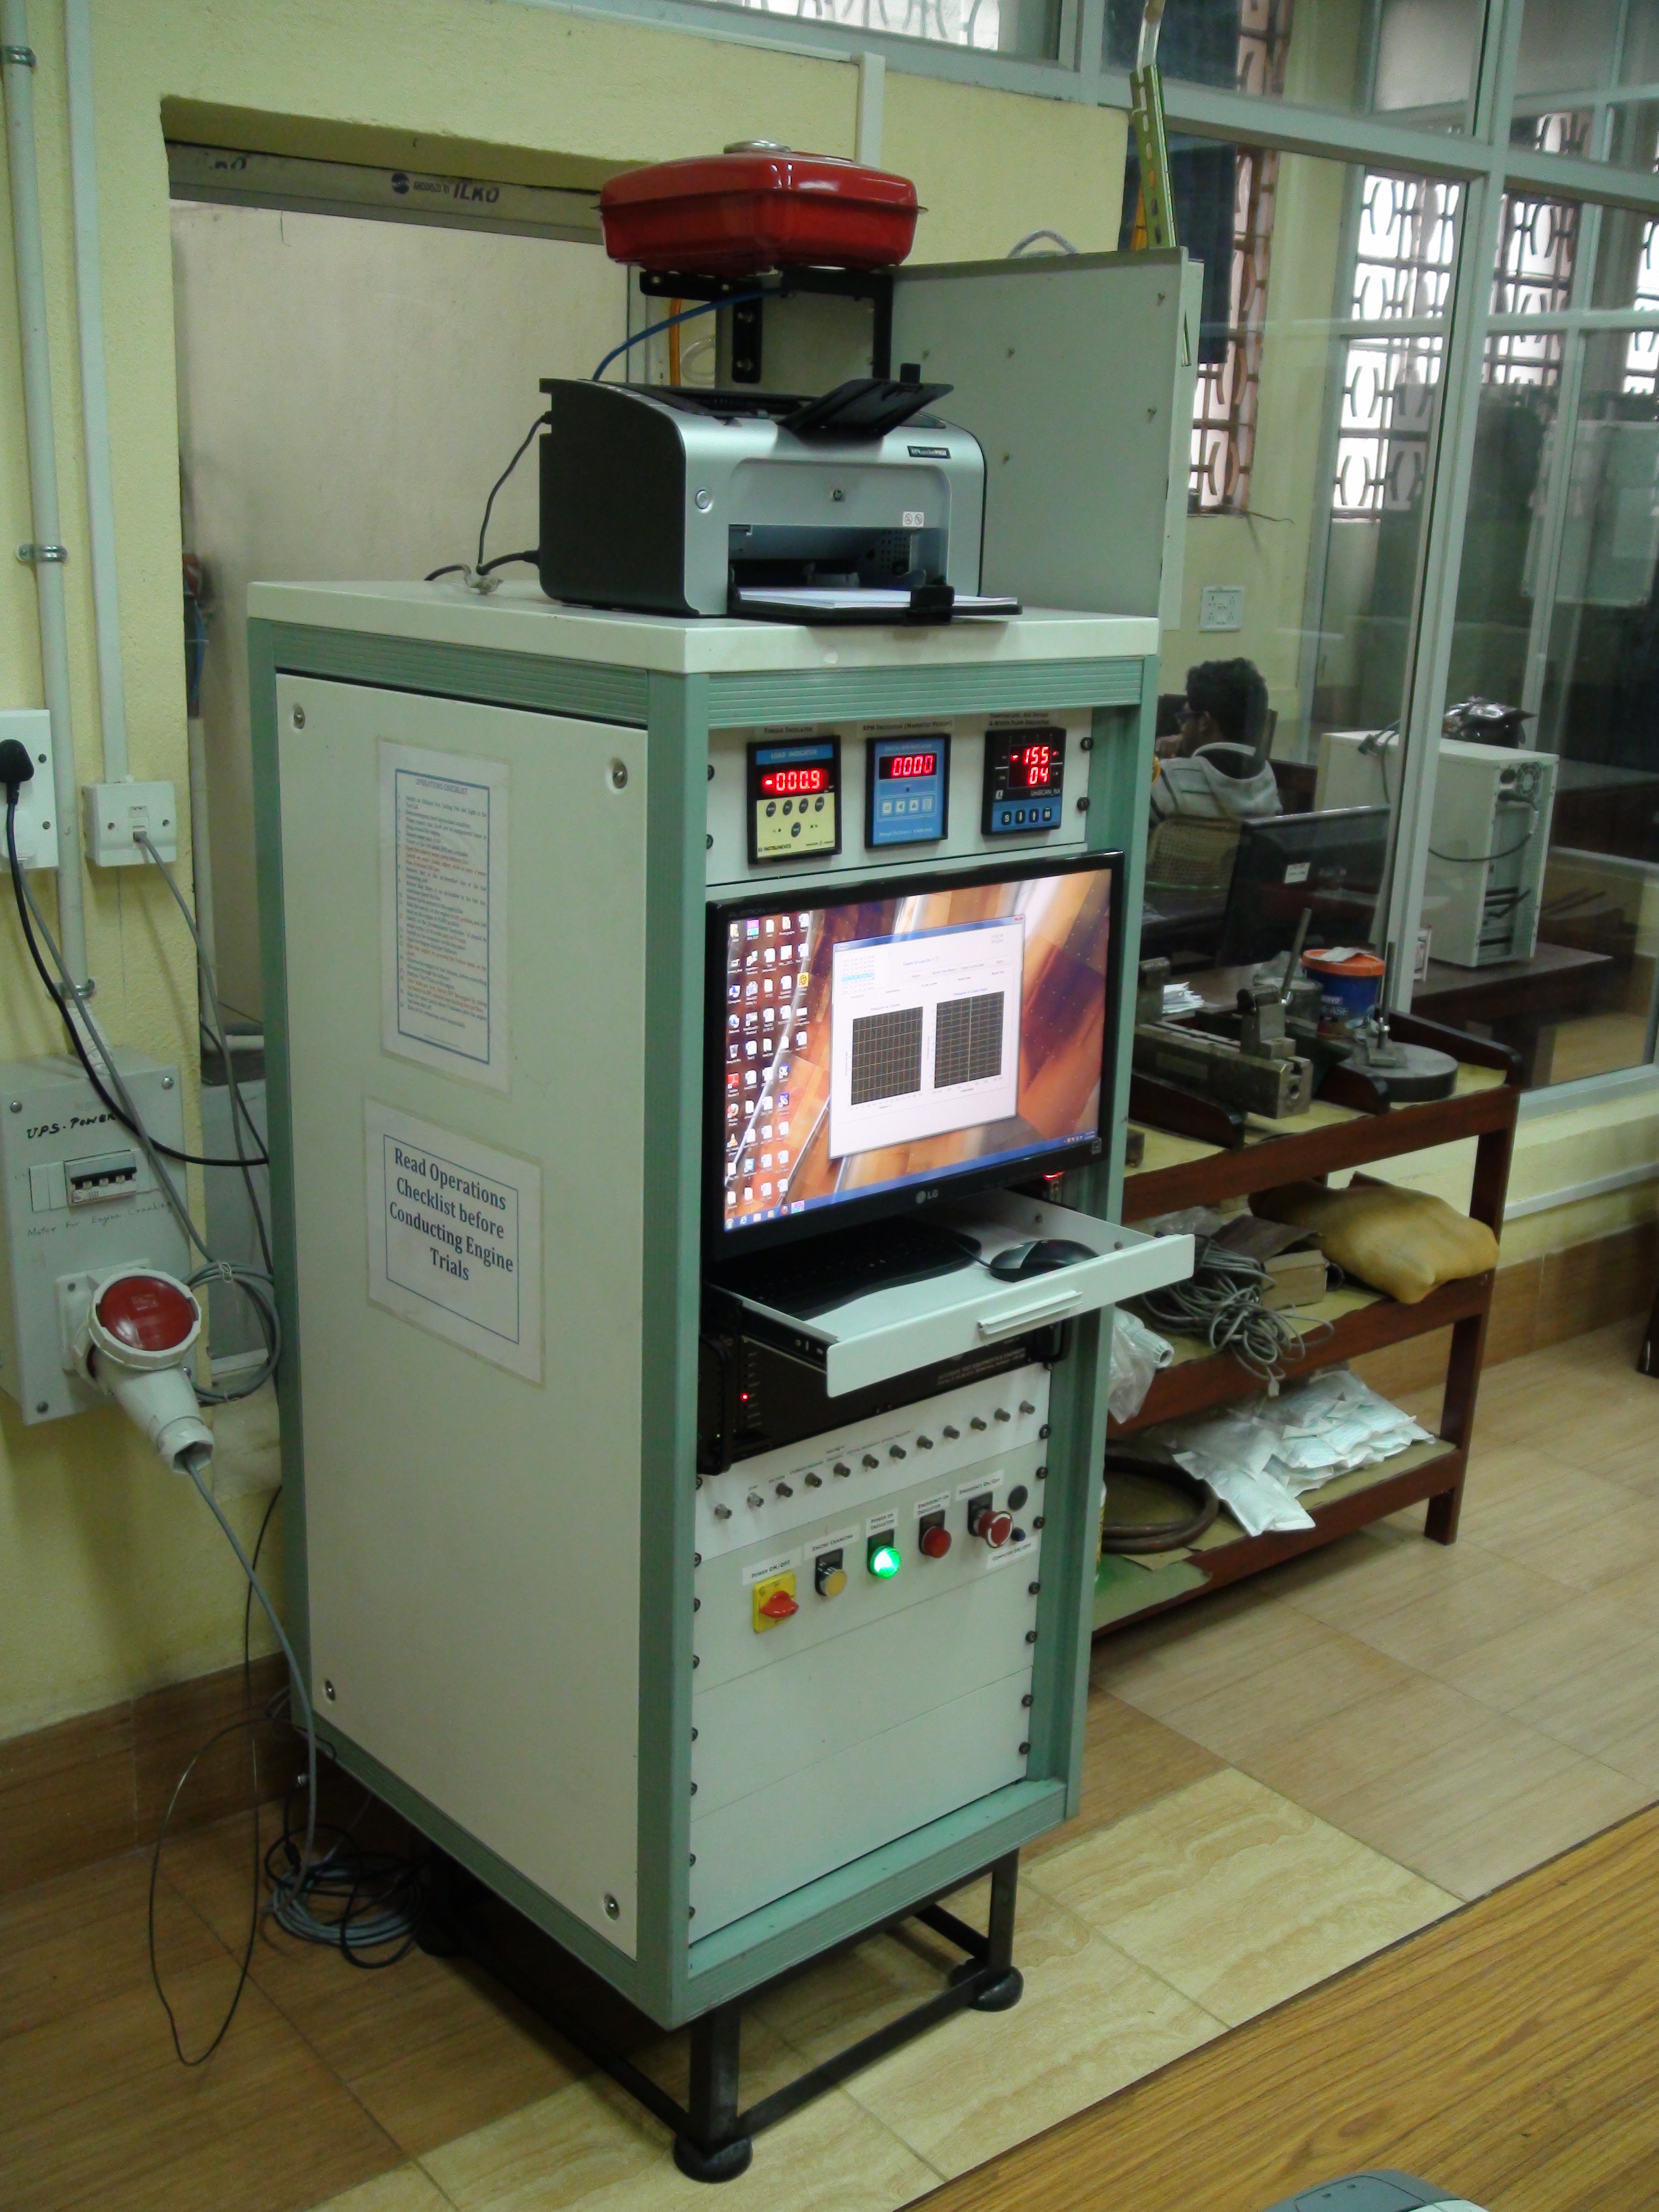
This remote triggered virtual lab is accessible over the internet you have to use the login user id and password provided to you when you registered for this experiment.
Please refer to the detailed procedure sent to you by email. You need to have team viewer software installed in your computer with an high speed internet access. You'll be able to get visual feed from the lab where the experimental setup is physically placed while the experiment is being conducted you have the option to access and retrieve the experimental data over the internet to your computer for further processing.
For working from the lab , one has to switch on the water pump, the motor, fuel supply, and the control panel.Once the computer starts, you need to open the already installed EPA software. Then you have to crank the engine. Once the engine starts go to Online data.you can get the `P-V` and `P-CA` curves, Heat balance data and other data by clicking START. Adjust the dynamometer load control for varying the torque.To get the fuel meter reading , click FC Meter Start and simultaneously open the valve of the fuel pipe. When both the indicators turn light green, close the valve and you get the reading in seconds.You can save data for 5 loads namely LOAD 1, LOAD 2, and so on. Finally , you can go in history and check the previously saved data.
Precautions
- Shoes are a must in the lab. It protects us from electrical shocks and from any heavy device falling on our feet.
- The nut closing the opening of fuel pipe must be opened.
- No bubble must be present in the fuel tube.
- The water flow rate must be around 100.
- The emergency door must be kept open.
- The water tank must be full and must have pure water.
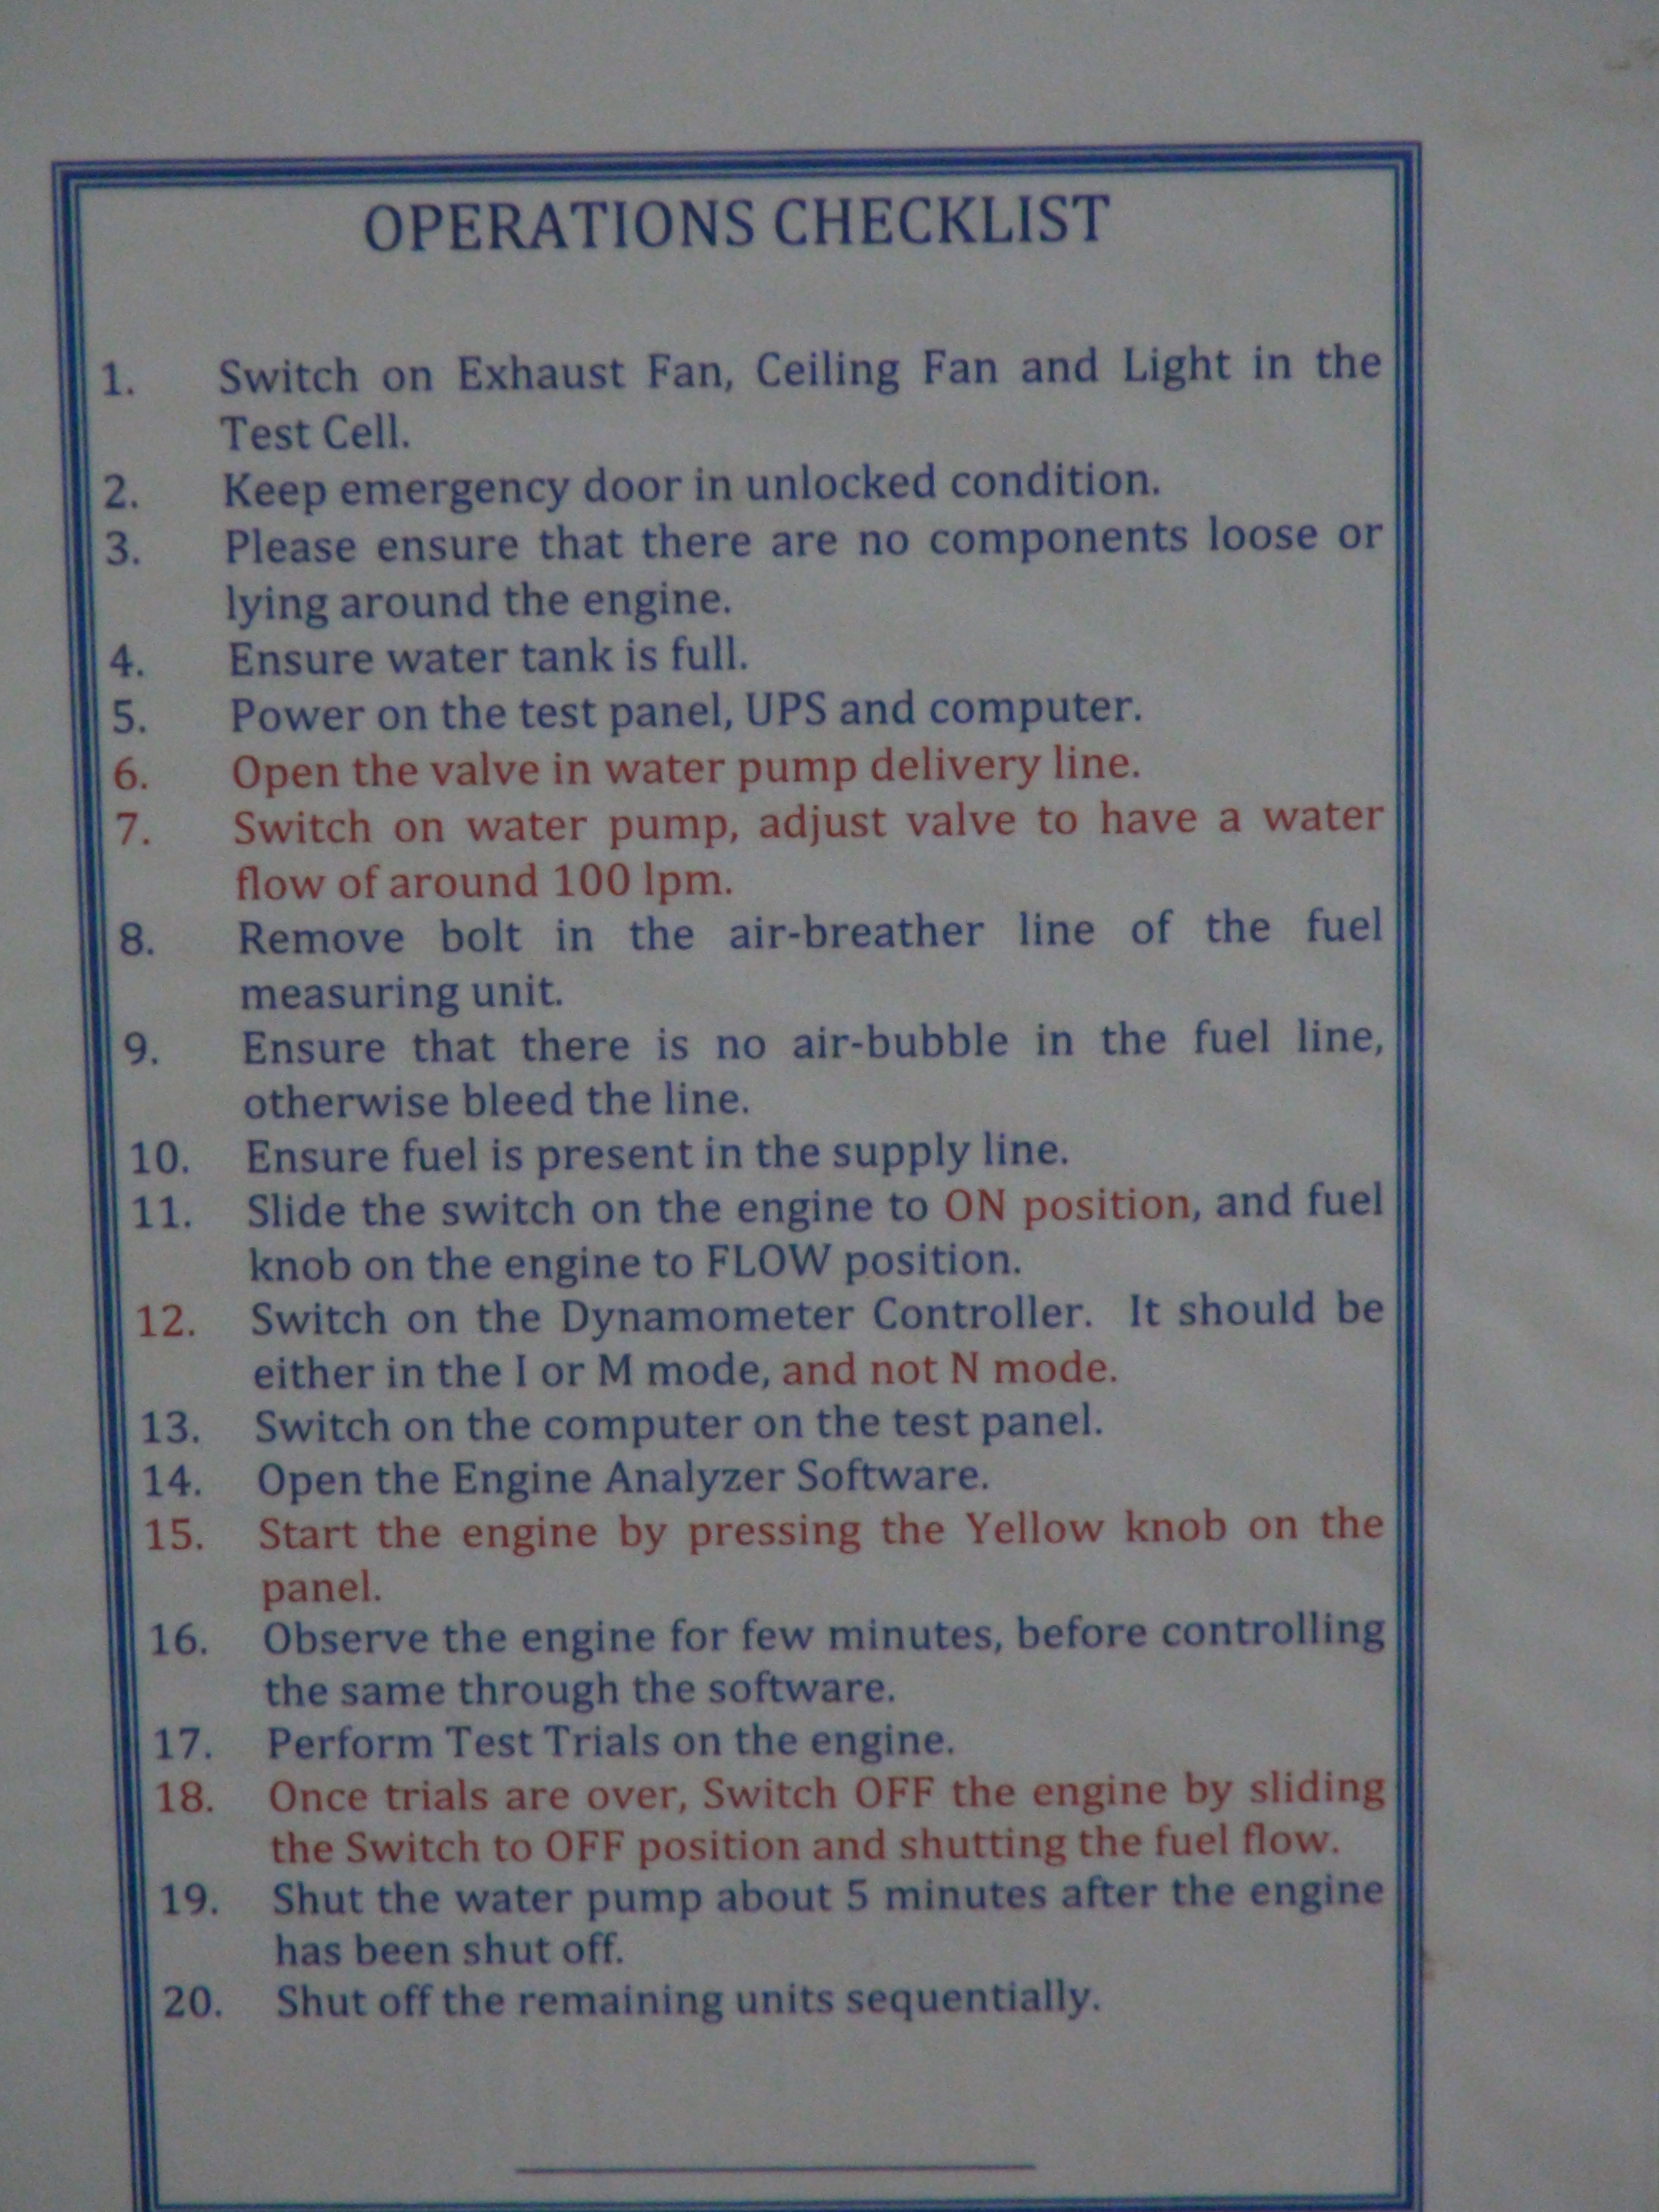


Fig. Load 1 - 2.3 Nm

Fig. Load 1 - 5.2 Nm
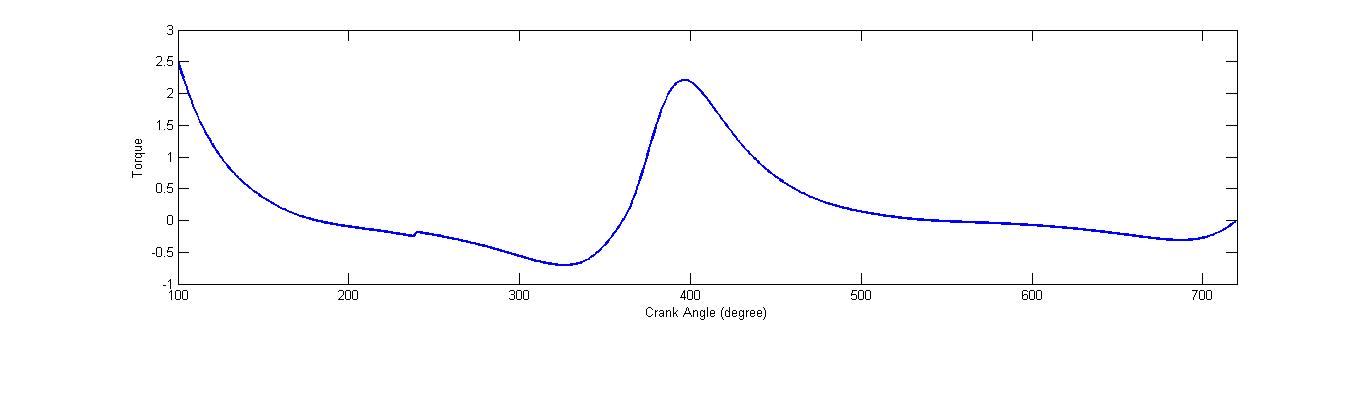
Fig. Load 1 - 7.4 Nm
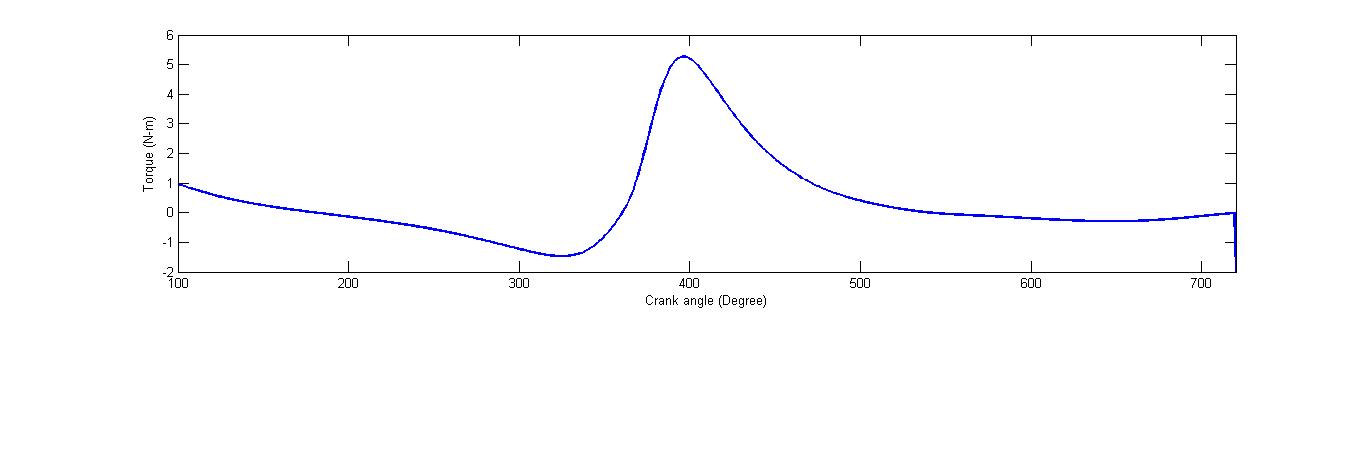
Fig. Load 1 - 9.3 Nm

Fig. Load 1 - 11.1 Nm
Conclusions
The area under the torque vs crank angle curve gives the work done in a cycle. There is always a peak near about a crank angle of 400 degrees .


Books
- M L Mathur and R P Sharma, "A Course in Internal Combustion Engines", Dhanpat Rai & And Sons(1994)
- C R Fergusan and A T Kirkpatrick, "Internal Combustion Engines", John Wiley & Sons(2001)
- V Ganesan, "Internal Combustion Engines", Tata McGraw Hill(2003)
- J B Heywood, "Internal Combustion Engine Fundamentals", McGraw Hill.(1999)
- S Srinivasan, "Automotive Engines", Tata McGraw Hill.(2001)
- Amiya R Mohanty, "Machinery Condition Monitoring Principles and Practices", CRC Press(2014)
Web Resources
- http://www.freestudy.co.uk/dynamics/tm%20diagrams.pdf
- http://en.wiki2.org/wiki/Piston_motion_equations
- http://en.wikipedia.org/wiki/Internal_combustion_engine
- http://machinedesign.com/fea-and-simulation/new-techniques-predict-machine-vibration
- http://mechteacher.com/otto-cycle-mean-effective-pressure-derivation/
- http://web.itu.edu.tr/~sorusbay/ICE/index_files/LN07.pdf
- http://en.wiktionary.org/wiki/crank_angle
- http://enginemechanics.tpub.com/
- http://www.howstuffworks.com/
- http://www.eng.fsu.edu/
- https://mysaclink.csus.edu/
- http://www.w3schools.com/html/
- http://www.polytec.com/vibrometers
- http://www.britannica.com/EBchecked/topic/371842/mechanical-efficiency