
All bearings have some defects, and they are graded accordingly. It is only a matter of degree of defects that separates' out the highest - quality bearings from the lowest quality ones. The primary causes of bearing failures are:
1. Contamination, including moisture (Some sources claim that 40 percent of bearing failures are caused by contamination).
2. Overstress
3. Lack of lubrication
4. Defects created after manufacturing
Bearings typically achieve only about 10 percent of their rated life. Tests of bearing life under laboratory conditions yield lives of 100 to 1000 years. Clearly, the design and manufacturing do not present deficiencies that limit their life. In the laboratory, there is no contamination of dirt or water, there is little imbalance or misalignment to cause overstress, the lubrication is the best, and the bearing is handled as if it were a delicate instrument, which it is. Under service conditions, these factors are not all optimum as they wear during the laboratory tests. The prediction of bearing failure is useful information to the production manager, but the root cause of the failure is the key information that can prevent a recurrence. The point of this discussion is that very few root cause failure modes originate at the factory, the majority of failures are worked into bearings once they get into our hands.
This experiment shows the four important bearing faults and their characteristic vibrational frequency. The equipment can be done by changing various factors such as no. of balls, rpm, etc.
A great deal of machines are equipped with roller bearings. The basic bearing function is to transfer forces from rotating parts to the construction and to reduce friction in the system. In almost all cases, bearings are the most precise machine parts, generally made with tolerances that are ten times lower than tolerances of other machine components. However, only about 10 to 20% of bearings reach their design life because of different factors that reduce their life. These include particularly imperfect lubrication, using improper lubricant, contamination with dirt or other foreign particles, improper storage out of shipping containers, moisture intrusion, false brinelling (imprint of rolling elements to the race) during transport or when the machine is out of operation for a long time, using an inappropriate bearing for the particular purpose, incorrect installation of bearings, etc.
But main causes for early bearing failures are excessive vibration and high dynamic loads which can thus be transmitted to the bearings. If the care is taken to eliminate the unfavourable external influences, such as unbalance, misalignment, problems of drive belts, soft feet, inadequate lubrication and incorrect installation, then the bearings should have adequate durability.
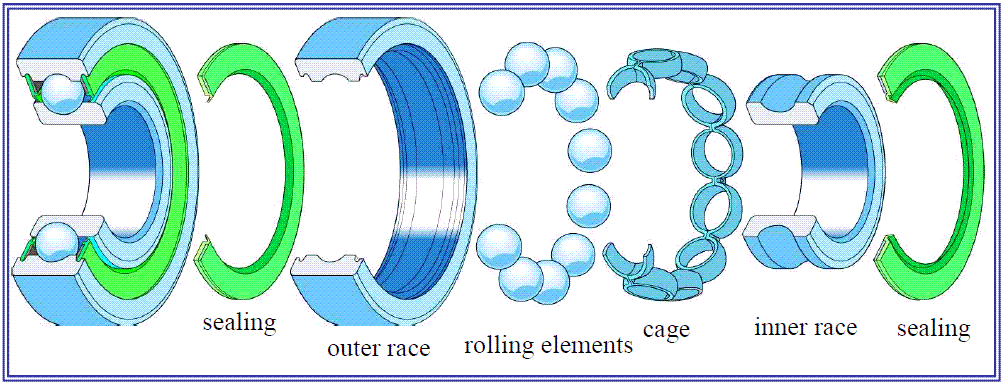

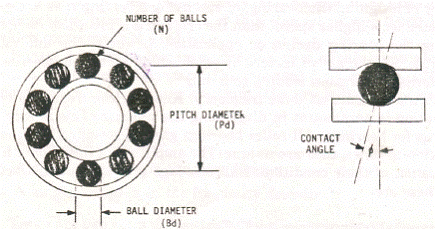
Bearings are the most vital components of rotating systems. The four important types of bearing problems are defective balls, outer race, inner race and the cage.
The objective of this experiments is to show how these defects can be identified by vibration monitoring. Various combination of parameters such as number of balls, ball dia, contact angle, pitch dia and shaft RPM can be selected for conducting experiment.

1. Bearing Basics
(a) A bearing is a machine element that constrains relative motion and reduces friction between moving parts to only the desired motion. The design of the bearing may, for example, provide for free linear movement of the moving part or for free rotation around a fixed axis; or, it may prevent a motion by controlling the vectors of normal forces that bear on the moving parts. Many bearings also facilitate the desired motion as much as possible, such as by minimizing friction. Bearings are classified broadly according to the type of operation, the motions allowed, or to the directions of the loads (forces) applied to the parts.
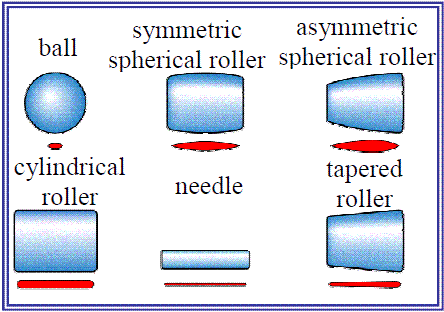
(b) Bearings are further divided by the type of rolling element and thus by the nature of the transmitted forces. Common types of rolling elements with schematic representation of transmitted forces are listed in Fig below:
2. Parameter for Assessing Rolling Bearing Condition
Condition monitoring of rolling element bearings and determining when they would need replacement are of great importance in terms of machine operation. When a rolling bearing becomes damaged, the vibration signal transmits to the stator part where it can be measured using accelerometer. However, for proper evaluation of rolling bearings condition one can rely neither on measuring the overall vibration only, nor on measuring the broadband value in the ultrasonic range. When deciding which of the vibration parameters (displacement, velocity or acceleration) will be used to assess bearings condition, it is appropriate to realize the following:
(a) Displacement - Since the displacement is significant at low frequencies, it tends to suppress or eliminate almost the entire spectral content that indicates bearing faults. Therefore, it is not used for assessment of rolling bearings.
(b) Acceleration - Unlike the displacement, acceleration tends to over-emphasize most of the frequency content generated by rolling bearing faults. The result is that the acceleration spectra may cause a false alarm. Although acceleration is a better indicator of bearing problems in early stages, it is more suitable to use vibration velocity to evaluate the fault that is already developed. Vibration velocity more clearly indicates "the truth" about bearing condition. Acceleration spectra can detect bearing problems in earlier stages of the fault than velocity spectra, especially for high-speed machines. In addition, the envelope demodulated high-frequency spectra can provide warning of bearing wear or lubrication problems even earlier and, therefore, are widely used nowadays.
(c) Velocity - Velocity spectra are one of the best parameters for evaluation of most rolling bearings problems. Generally speaking, the velocity remains "flat" in the frequency range from 10 to 2000 Hz. This means that when the bearing defect frequency appears at 100 Hz or at 1000 Hz, the same weight can be used for evaluation.
3. Types of Vibration Generated by Defective Rolling Bearings
Defective rolling bearings generate three types of frequencies when a fault is developing, namely:
(a) Random Ultrasonic frequencies Measurement of ultrasonic frequencies from about 5000 Hz to 60 000 Hz involve measurements of spike energy, measurements of spectral emitted energy (SEE), measurement of high-frequency acceleration spectral density (HFD), measurement of shock pulses and others. Each of these techniques is considered as a parameter to detect an emerging fault. Generally speaking, a number that these methods give is only one of information that must be considered when assessing the condition of a rolling bearing.
(b) Natural Frequencies of Installed Bearing Components Natural frequencies of a rolling bearing are usually in the range from about 500 to 2000 Hz. If the bearing is defective, these natural frequencies are excited by periodic impacts of rolling elements to defects on the rolling traces and can be detected. When the wear is getting worse, sidebands appear around these resonant frequencies at intervals of rotational frequency or at distance equal to the bearing defect frequency.
(c) Bearing Defect Frequencies Over the years, many formulas have been derived that can help to detect specific defects in rolling element bearings. They are based on the geometry of the bearing, the number of rolling elements and the rotational frequency of the bearing. Four types of faults are distinguished on the rolling bearing depending on where the fault occurs. The so called bearing defect frequency that can be calculated on the basis of bearing parameters and rotational frequency corresponds to each of these defects:
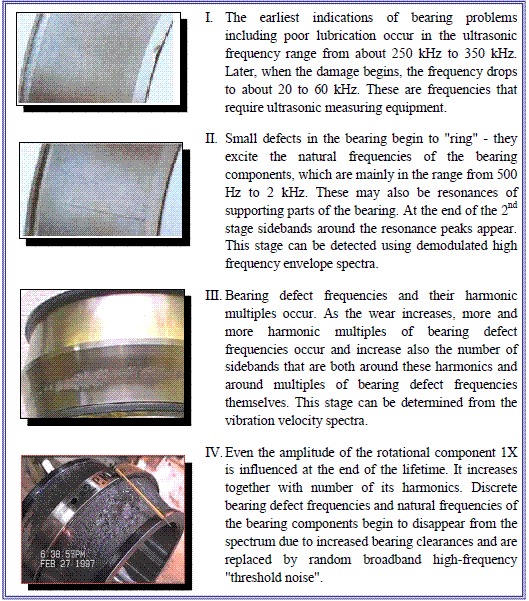
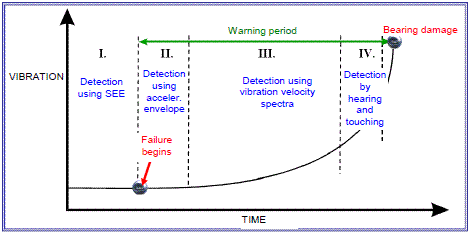
4. Stages of Rolling Bearing Fault Development
It was found that most of the rolling bearings follow the well predictable course to failure from the early beginning to the eventual catastrophic failure. This course of fault development is illustrated in Fig. below where bearing damage evolution in time is drawn. Note the important fact that the bearing damage typically develops exponentially over the last 10 to 20% of its lifetime. The course of damage that consists of four stages is applicable to about 80% of rolling bearings failures.
Development of rolling bearing faults can be divided into four stages:
Bearing Defects of Various Types
To be able to monitor bearings is the reason that most vibration analysis programs are started. The state of this technology certainly allow this to be done with confidence. Ninety percent of bearing failures can be predicted months before hand. There are still approximately 10 percent of bearing failures that are abrupt and unforeseen. Being able to predict the 90 percent majority is a good enough reason to invest in a bearing monitoring program for many companies. However, if this is the only use of the vibration instrumentation, then it is underutilized.
There are very few "bad" bearings coming out of bearing factories. The state of quality control at these facilities is of the highest caliber of any manufactured goods. Bearings fail for several reasons, the least of which is a manufactured-in defect. All bearings have some defects, and they are graded accordingly. It is only a matter of degree of defects that separates' out the highest –quality bearings from the lowest quality ones. The presence of these defects is not the primary cause of bearing failure. The primary causes of bearing failures are:
1. Contamination, including moisture (Some sources claim that 40 percent of bearing failures are caused by contamination. This is certainly believable based on my field experience.)
2. Overstress
3. Lack of lubrication
4. Defects created after manufacturing
Bearings typically achieve only about 10 percent of their rated life. Tests of bearing life under laboratory conditions yield lives of 100 to 1000 years. Clearly, the design and manufacturing do not present deficiencies that limit their life. So why don't bearings under service conditions achieve those running times? The answer is that in the laboratory, there is no contamination of dirt or water, there is little imbalance or misalignment to cause overstress, the lubrication is the best, and the bearing is handled as if it wear a delicate instrument, which it is. Under service conditions, these factors are not all optimum as they wear during the laboratory tests. The test prove that long life is achievable with same care. If a bearing is not archiving its rated life, the appropriate question to ask is, "Why not?" The prediction of bearing failure is useful information to the production manager, but the root cause of the failure is the key information that can prevent a recurrence. The point of this discussion is that very few root cause failure modes originate at the factory, the majority of failures are worked into bearings once they get into our hands. This is good because we can't do much about factory defects. We can do a lot with preventing the defects that we, as users, create. The defects that will cause failure are probably present the instant the machine is energized, and modern vibration instruments can detect them. The goal of the vibration analyst should be to not only warn the production manager of impending bearing failure (a computer can do that) but to analyze the data, look for patterns, and apply reason to find the root cause. A computer has some difficulty with this latter function.
If the above causes-contamination, overstress, lubrication, and defects-can be ruled out and continued bearing failures occur at the same machine, then it is appropriate to question the design. Is this the right bearing for this application? Some bearing problems have been solved by redesigning the bearing, or specifying a bearing that is bigger or rated for a higher speed, than the original one installed. Before attacking the bearing design or application, however, the analyst should rule out the above factors by establishing vibration baseline and patterns of vibration leading to failure.
All vibration occurs at some frequency. Knowing the frequency of the vibration is paramount in diagnosing the problem. This is especially true for bearing. All roller bearings give off specific vibration frequencies, or tones, that are unique. The amplitude of these tones is an indication of their condition. Ball bearings give off four distinct tones. These are:
Fundamental train frequency (FTF)
Ball spin (BS) frequency
Outer race (OR)
Inner race (IR)
The formula for calculating these specific frequencies are
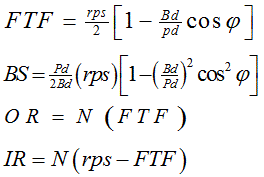
Where rps = revolutions per second of inner race
Bd = ball diameter
Pd = pitch diameter
N = number of balls
= contact angle
Ball bearings that carry no thrust load are assumed to have zero contact angle.
Be advised that these4 formulas are theoretical, and the difference between calculated and measured bearing frequencies can be as much as several hertz. The discrepancies arise when ball bearings have significant thrust loads and internal preloads. This changes the contact angle and causes the outer-race frequency to be higher than calculated.
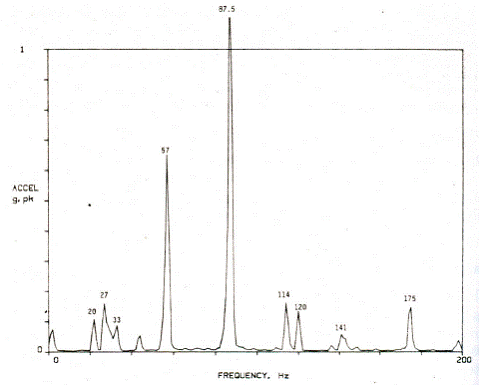
Tables of tabulated bearing frequencies are available. As an example, Fig. 1.2 contains a vibration spectrum of an NSK 6311 bearing turning at 1715 rpm. The bearing, its mounting, and the drive motor is pictured in Fig. 1.4. The accelerometer was stud mounted in the vertical direction. The motor has sleeve bearings. The bearing tables 1 have access to do not list an NSK 6311 bearing. This points out one problem with bearing tables. The bearing you are interested in may not be listed. But 6311 bearings are listed of FAG,SKF, and NTN brands. Their data is tabulated in table 1. this table points out another feature of bearing tables, i.e., the same bearing number from different manufacturers may produce different frequencies. The discrepancies may be larger than this. Bearing tables assume that the shaft rotates and that the outer race is stationary. If these conditions do not exist, then the tabulated numbers do not apply. One final point, bearing manufacturers reserve the right to change the internal construction of their bearings without changing their number designations. That is, they can change the number of balls, size of balls, or pitch diameter, and as long as it does not affect form, fit, or function, the new bearing will retain the old number. Their only obligation is that it be interchangeable on the machine, not that it generate the same frequencies. I have found some tabulated bearing frequencies to be grossly in error with measured frequencies. The reason for the gross error with measured frequencies. The reason for the gross error is believed to be old tabular data which did not match the present bearing geometry.
TABLE 1 Bearing Frequency Factors
The bearing frequencies are found by multiplying the numbers in Table 1 by the rotational speed of the shaft. If we take the data for the SKF 6311 bearing, as an average, we will come up with the frequencies in Table 2.
In Fig. 1.2, the higher three frequencies do appear. The fundamental train frequency (FTF) does not show, and it rarely does, unless a serious cage defect exists. The vibration peaks at 57 and 87.5 Hz are likely the ball spin (BS) and outer-race (OR) frequencies, but they could also be harmonics of running speed. The harmonics of running speed are
2 X 28.58 = 57.16 Hz
3 X 28.58 = 85.74 Hz
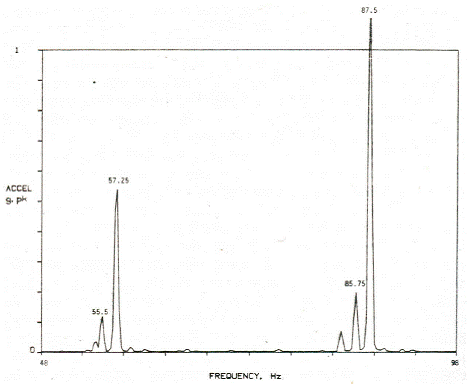
One way to sort this out is to zoom in closer to these peaks. This has been done in Fig. 1.3. Here we see the 57-Hz peak divide into two prominent vibrations at 55.5 and 57.35 Hz. The 57.25 Hz is most likely a combination of ball spin plus a harmonic of running speed. The two frequencies are too close and overlap. Further zooming will separate the two. This illustrates a problem with monitoring bearing frequencies that the analyst should be aware of. Whenever the bearing frequency factors in Table 2 are very close to a whole number, then the calculated bearing frequency will overlap a harmonic of running speed. The 87.5 Hz peak divides into a vibration at 85.75, which is certainly the 3X harmonic of running speed, and a peak at 87.5 Hz which is clearly the outer-race frequency.
TABLE 2 Bearing Frequencies for SKF 6311 Turning at 1715 rpm (28.58 Hz)
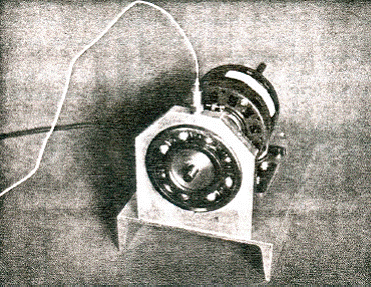
This bearing was run dry with no lubrication, in a test setup shown in Fig. 1.4. The motor rotating the NSK 6311 bearing had sleeve bearings, which generate no discrete vibrations. This NSK 6311 bearing came from a 20-hp motor that had run for several years driving a fan via a belt. This bearing was on the drive end of the motor. It was removed because it made a noise that caused the maintenance person concern, so he installed a new bearing and gave me the old one. This NSK 6311 bearing was actually okay, that is, there was no visible defects on either of the races or the balls, but it generated significant vibration when run dry, as evidenced by Fig. 1.3. An acceleration of 1g at a bearing frequency is cause for concern.
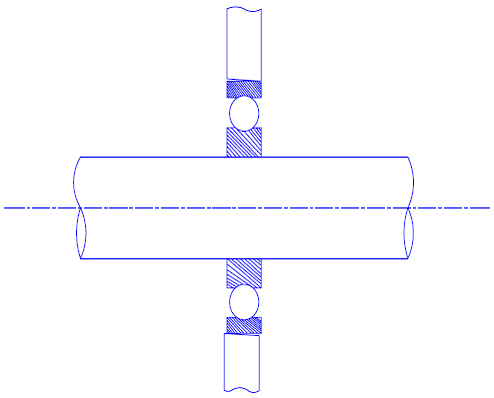
Notice in Fig. 1.4 that the accelerometer is mounted in a vertical direction. This is the best orientation to monitor bearing vibrations on horizontal shaft machines because the accelerometer sensitive axis is in line with the bearing load zone. The bearing load zone is typically a 45 ° arc centered on the bottom of the bearing (Fig. 1.5).
This bottom centered load zone is valid where the gravity weight of a machine is the primary force on the bearings. Where different directional forces act on a bearing, such as belt-driven fans, then the load zone will be different. Thrust bearings obviously have an axial load zone, and they are better monitored in the axial direction. For normal machines with a dominant gravity force on the bearings, monitoring in the vertical direction is the best to see bearing frequencies. Imbalance, however, is best directed by mounting a transducer horizontally because most machines are more flexible in that direction. If only one transducer is to be mounted on a bearing, then a compromise needs to be reached based on the purpose of monitoring. For bearing frequencies, it is actually best to monitor directly in the load zone. For most bearings, this means on the bottom, which is impractical. If that is the case, then it is sufficient to just monitor in the same direction as the dominant bearing forces, i.e., vertical.
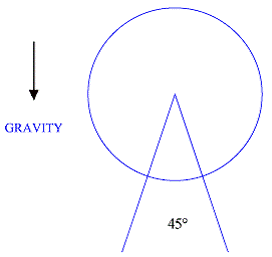
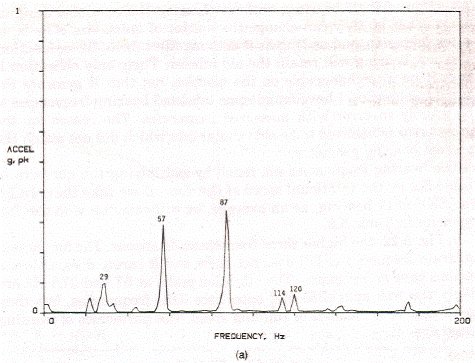
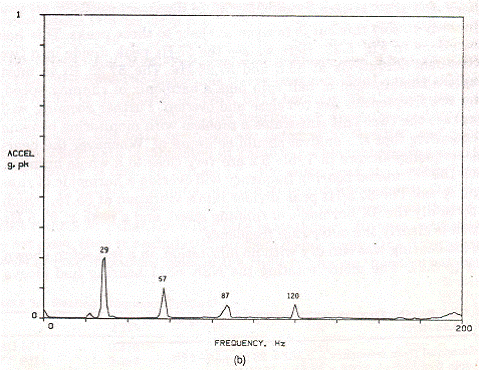
Figure 1.6 Bearing demonstrator with NSK 6311 bearing. (a) Accelerometer mounted at 45 °. (b) Accelerometer mounted horizontal (see Fig. 1.2 for the vertical direction). Figures 1.6a and 1.6b are comparable plots of the same NSK 6311 bearing tests as in Fig. 1.2. Figure 1.6a is with the accelerometer mounted at a 45 ° angle, and Fig. 1.6b is with the accelerometer mounted horizontally. Notice how the bearing frequencies at 57 and 67 Hz decrease dramatically when moving the accelerometer away from the vertical direction. This example emphasizes the need for proper transducer orientation to monitor bearing vibrations.
If bearing tables are unavailable, then bearing frequencies can be approximated with these simple rules of thumb:
FTF = 0.4 (speed)
OR = 0.4 (speed) X N
IR = 0.6 (speed) X N
Where N = number of balls
These formulas are based on the fact that the cage rotates 40 percent as fast as the shaft. This can be easily verified by hand rotating any ball bearing after marking the cage and turning the inner race 360 °. According to these formulas, the outer-race frequency is 40 percent of the rotational speed times the number of balls. The inner-race frequency is 60 percent of the rotational speed times the number of balls. The speed can be measured. Most ball bearings have between 7 and 15 balls, with the majority falling between 9 and 11. So if the number of balls is not known, assume 10 balls, then a rough estimate can be made of the outer and inner-race frequencies by multiplying the speed by 4 and 6, respectively. This has proven useful to tentatively identify bearing frequencies while taking field measurements.
Equations (5.7) through (5.90 have been proven to be within 2 percent when the number of roller elements is less than 12. The error increases with more elements.
The relative amplitudes of these vibrations is an indication of the bearing condition. These bearing frequencies will be present on new bearings, even if lightly loaded. As the bearing parts wear, these specific tones get louder, or higher in amplitude. The frequency remains the same. The very first indications of bearing wear are metal-to-metal impact shocks. These meta impacts are the balls, or rollers, making contact with the races or cage assembly. They show up as shock pulses in the time domain with a frequency between 1000 and 10,000 Hz. They can also be seen in the frequency domain as random peaks that come and go. They average out to some broadband vibration in the frequency domain, so it is best to view them in the time domain with an accelerometer as a transducer. The presence of these shock pulses do not necessarily a bad bearing. What they do indicate is metal-to-metal impacts due to defects, high loads, or lack of lubrication. If this condition is left to continue, it will most certainly lead to accelerated wear and premature failure.
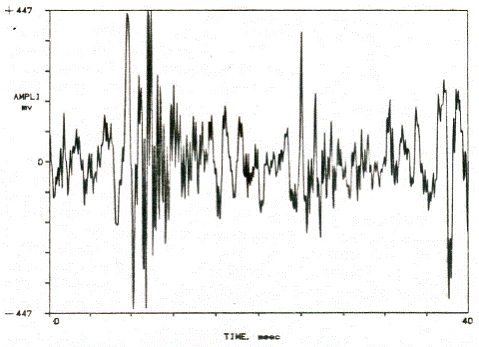
Figure 1.7 shows a time plot of a "bad" bearing. Notice the shock pulses that swing between the top and bottom extremes of the amplitude. This bearing came from an automotive transmission that was found lying in the road. There was significant spalling and pitting on both the outer race and inner race that was clearly visible. I once viewed a bearing on a 100-hp motor that displayed even more severe shock pulses than this. I thought it was due to heavy load and did not notify the owner. Four days later it failed during a holiday weekend.
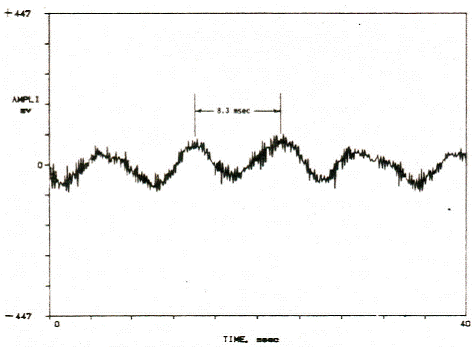
When viewing bearings for shock pulse, it is best to set up a consistent display window for comparison purposes. With a 100 mV/g accelerometer, I have found a time length of about 40 msec and an amplitude scale of about ±0.5 V to be good. For comparison, Fig. 1.8 is a new bearing, and it is well lubricated. The 8.3-msec period is the 120 Hz vibration from the motor. If the 120 Hz from the motor were absent, then the time plot of this good bearing would have a small amplitude excursion. No severe shock pulses are present.
Even without any instruments, these shock pulses due to metal impacts can be heard with your ear to the bearing via a screwdriver. It is best to listen to this "ticking" during coast-down when power has been removed and electrical and turbulence noise is absent.
As wear progresses, these shock pulses increase in number and severity. Bearing analyzers typically look for and count these high frequency shock pulses. They display their result as "Spike Energy" or "BCU" bearing condition units. Be aware that other, nearby high frequencies can be detected also by these instruments, i.e. belt squeal, coupling guard rubs, pump cavitation, control valve noise, steam leaks, or other impacts. These other sources get counted in as bearing noise.
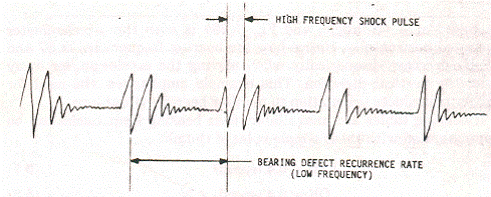
It is important, at this point, to summarize the two types of vibrations emanating from bearings. The first discussed was the repetition rate of balls encountering a defect. These are the low-frequency vibrations from 4 to 10 times running speed. These are shown in Fig. 1.9 as the bearing defect recurrence rate. The period of this defect is the time interval between balls encountering the same defect. When the ball encounters this defect, it is a metal crash, and a high-frequency shock pulse travels through the bearing housing as a pressure wave. Both of these vibrations can be detected by the accelerometer. The short-duration transient nature of the shock pulses makes them not very visible in the frequency domain, but they can be clearly seen in the time domain. Therefore, the earliest detector of bearing degradation are these high-frequency shock pulses.
As bearing wear progresses, defects show up first on the outer race as spalling. The amplitude of the outer-race frequency increases as the spalling gets deeper. In the final stages of failure, the rollers transfer the spalling to the inner race, and inner-race frequencies increase. During this process, the shock pulses get bigger and more frequent. The relative amplitude of outer-race frequencies and the presence of inner-race frequencies will indicate the time to failure.
From experience, 0.1 in/sec at a specific bearing frequency indicates a significant visible bearing defect. This corresponds to 0.1 to 0.3 g in the range of normal bearing frequencies from 60 to 200 Hz. That is, if the bearing were disassembled at that point and visually inspected, a visible defect with the naked eye could be seen, probably on the outer race. This does not mean, however, that the bearing needs to be changed. That decision is up to the responsible maintenance professional with other factors being considered, such as production requirements, adverse consequences of continued operation, availability of spare parts, and the next scheduled maintenance downtime.
Bearings are load-carrying members and will continue to carry the load even into the final stages of failure. Some companies continue to operate bearings beyond the first signs of degradation and well into the failure cycle. Sometimes this is due to necessity to get beyond a production cycle, and other times it is a matter of choice based on past experience. The responsibility of the vibration analyst is first to notify the production manager of a developing defect, and then to keep him or her advised with more frequent monitoring as the bearing progresses toward failure.
One final note concerning bearing vibrations. Bearing can be installed in a misaligned condition, i.e., their axis not being perpendicular to the housing bore. The shaft and housing are then both distorted cyclically during rotation. The vibration spectrum of a misaligned bearing looks just like a misaligned coupling, with harmonics in the spectrum. The other diagnostic indicators of misalignment are also present; high axial vibration at 1X rpm and 180 ° phase differences. It is difficult sometimes to separate the two, coupling misalignment versus bearing misalignment. A bowed rotor can also display the same symptoms of harmonics. Some additional analysis techniques need to be used to separate out the true fault, such as:
Run driver solo.
Measure shaft runout with a dial indicator while hand turning.
Carefully inspect shaft and bearing surfaces visually for contact points and wear patterns.
1. How do the bearing defect frequencies differ from other defect frequencies?
One of the factors that distinguishes bearing defect frequency from other sources of vibration is that they are frequencies of existing defects. In other words, if a defect does not exist, bearing defect frequencies are not present. When they are present, it is the information that there is a problem arising. Other common frequencies, such as 1X rotational frequency, blade pass frequency in pumps, gear mesh frequency, etc., are always present and their presence does not necessarily mean that there is a fault or a problem. The presence of bearing defect frequencies sends a message "be careful" to the diagnostician. It is important to emphasize that the presence of such frequencies does not necessarily mean that there are defects directly in the bearing. They can also occur when insufficient lubrication allows the metal contact or when the bearing is loaded incorrectly.
2. Bearing defect frequencies are not integral multiplies of the rotational frequency?
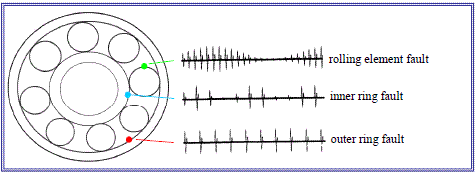
Bearing defect frequencies are not harmonics of the rotational frequency. They represent one of the few vibration sources that generates non-integral multiplies of the rotational frequency. Fig. below illustrates how the bearing defect frequencies are generated in the bearing:
A fault on the outer race on the bottom of the bearing in the load zone (red dot) generates a pulse on the waveform always when the rolling element passes over the defect and hits it (ideally the impulses are of the same magnitude). When a defect is on the inner ring (blue dot), the pulse occurs on the waveform each time when the inner ring passes over each rolling element (assuming that the inner ring is pressed onto the shaft). An important fact, which is shown in Fig. is that the magnitude of the response from rolling elements that hit the fault on the inner ring depends on the position of the inner ring at the moment when the hit occurs. This means that if a defect on the inner ring is in the loaded zone, it will have significantly greater response than if the same defect is in the unloaded zone. This explains why the frequencies of inner ring defects are often surrounded by sidebands at intervals of about 1X - their amplitude is modulated by the rotational frequency.
Fault on a rolling element (green dot) generates a pulse at each contact both with inner and outer ring. Magnitude of the impulse depends again on whether the contact occurred in the loaded or unloaded zone.

Procedure for Oil Whirl Monitoring -
Step 1: Put an accelerometer on the machine to measure overall vibration lavel.
Step 2: Switch on the machine. let it operate at its full design speed.
Step 3: Measure and note down the overall vibration.
Step 4: While monitoring vibration loosen and retighten any one volt.
Step 5: Note the minimum value of vibration level during Step 4.
Step 6: Repeat the step 4 and Step 5 for all bolts.
Step 7: Find that particular bolt which when loosened the vibration level is minimum.
Step 8: Check the Consistency of the vibration level reduction of the foot by repeating the experiment.
Step 9: If the vibration level reduction is consistent with repetition of the experiment in a particular bolt, this bolt/foot is known as soft foot. Shimming of this foot is required to permanently solve the problem.
Step 10: Determine the amount of shimming with dial indicator, shim accordingly, tighten the bolt and again measure the vibration. Change the amount of shimming and see which one gives the minimum overall vibration.
Step 11: Repeat the whole procedure again until there is no dramatic decrease in vibration level.


1. What are the fundamental reasons for bearing failures?
2. What are the four important vibration frequencies associated with ball bearing faults?
3. How do you diagnose the vibrations due to bearing faults?
4. How do you differentiate the inner race faults from the outer race fault of a ball bearing?
5. What are the factors affecting the vibrational frequencies of various types of faults of ball bearings?

- ANSI S2.2-1959 (R 1990) American National Standard Methods for the Calibration of Shock and Vibration Pickups.
- ANSI S2.11-1961 (R 1986) American National Standard for the Selection of Calibrations and Tests for Electrical Transducers Used for Measuring Shock and Vibration.
- ANSI S2.10-1971 (R 1990) American National Standard Methods for Analysis and Presentation of Shock and Vibration Data.
- ANSI S2.17-1980 (R 1986) American National Standard-Techniques of Machinery Vibration Measurement.
- ANSI S2.7-1982 (R 1986)(ASA 42) American National Standard-Balancing Terminology.
- ANSI S2.38-1982 (R 1990) American National Standard-Field Balancing Equipment-Description and Evaluation.
- ANSI S2.42-1982 (R 1990) American National Standard-Procedures for Balancing Flesible Rotors.
- ANSI S2.40-1984 (R 1990) American National Standard-Mechanical Vibration of Rotating and reciprocating Machinery-Requirements for Measuring Vibration Severity.
- ANSI S2.43-1984 (R 1990) American National Standard-Criteria for Evaluating Flexible Rotor Balance.
- ANSI S2.41-1985 (R 1990) American National Standard-Mechanical Vibration of Large Rotating Machines With Speed Range from 10 to 200 rev/s-Measurement and Evaluation of Vibration Severity in situ.
- ANSI S2.60-1987 American National Standard-Balancing Machines-Encloseres and Other Safety Measures.
- ANSI S2.19-1989(ASA 86) American National Standard-Mechanical Vibration-balance Quality Requirements of rigid Rotors, Part1: Determination of permissible residual Unbalance.
- ANSI S2.61-1989 American National Standard Guide to the Mechanical Mounting of Accelerometers.
- API 670. American Petroleum Institute. Non-contact Vibration and Axial Position Monitoring System.
- API 678. American Petroleum Institute. Accelerometer Based Vibration Monitoring System.
- API 541. American Petroleum Institute. Maximum Permission Vibration for Form-wound Squirrel-cage Induction Motors.
- Compressed Air & Gas Institute. In Service Vibration Standards for Centrifugal Compressors.
- Bently Nevada Seminar. Machine Protection Seminer, Bently Nevada, Minden, Neveda.
- Michael P. Blake and William S. Mitchell. Vibration and Acoustic Measurement Handbook, Spartan Books, 1972.
- Heinz P. Bloch and Fred K. Geitner. Machinery Failure Analysis and Troubleshooting. Gulf Publishing Company, 1986.
- Simon Braun. MSA-Mechanical Signature Analysis. American Society of Mechanical engineers (ASME), 1983.
- Jens T. Broch, Mechanical Vibration and Shock Measurements, 2d ed., 3rd impression, Bruel & Kjaer, Denmark, April 1984.
- Bruel & Kjaer Seminar. Modern techniques of Machine Vibration Analysis, Bruel & Kjaer, Naerum, Denmark.
- Bruel & Kjaer, Vibration Analysis of Machinery, Bruel & Kjaer, Naerum, Denmark.
- Bruel & Kjaer, Digital Signal Analysis Using Digital Filters and FFT Techniques. Bruel & Kjaer, Naerum, Denmark, January 1985.
- Ralph T. Buscarrello. Practical Solutions to Machinery and Maintenance vibration Problems. Update International, Lakewood, Colo.
- Edgar J. Gunter. Selected Papers on Field Balancing of Rotating machinery-Advanced Theory and Techniques. Vibration Institute, Willowbrook, Ill, May 1983.
- Cyril M. Harris and Charles E. Crede. Shock and Vibration Handbook, 2d ed., McGraw-Hill, New York, 1976.
- Cyril M. Harris. Shock and Vibration Handbook, 3d ed., McGraw-Hill, New York, 1988.
- J.P. Den Hartog. Mechanical Vibrations, 4th ed., McGraw-Hill, New York, 1956.
- J.P. Den Hartog. Mechanical Vibrations, 4th ed., Dover Publications, Mineola N.Y., 1985.
- Hewlett-Packard Application Note 243-1. Effective Machinery Maintenance Using Vibration Analysis. Hewlett-Packard Company, Palo Alto, Calif., 1983.
- Hewlett-Packard Application Note 243. The Fundamental of Signal Analysis. Hewlett-Packard Company, Palo Alto, Calif., 1982.
- Robert S. Jones. Noise and Vibration Control in Buildings. McGraw-Hill, New York, 1984.
- J. M. Juran. Quality Control Handbook, 3rd ed., McGraw-Hill, New York, 1979.
- Mechanical Technology Incorporated (MTI). June 1987 Seminar, Rotating Machinery, Vibration Analysis and Diagnostic Techniques. MTI, Latham, N.Y., 1973.
- John S. Mitchell. An Introduction to Machinery Analysis and Monitoring. PennWell Publishing, Tulsa, Okla., 1981.
- John Piotrowski. Shaft Alignment Handbook. Marcel Dekker, New York, 1986.
- Singiresu S. Rao. Mechanical Vibrations. Addition Wesley, Reading, Mass., 1986.
- J.D. Smith. Gears and Their Vibration: A Basic Approach to Understanding Gear Noise. Marcel Dekker, New York, 1983.
- W. Soedel. Vibration of Shells and Plates. Marcel Dekker, New York, 1981.
- Vibration Institute Seminar Procedings. Balancing of Rotating Machinery-Houseton, Texas. Vibration Institute, Willowbrook, III., February 26-28, 1980.
- Vibration Institute Course. Machinery Vibration Analysis I Course-Tempe, Arizona. Vibration Institute, Willowbrook, III., March 1-4, 1988.
- The Balance Quality of Rigid Rotors, ISO DR 1940.
- AD-A171 031, P.D. McFadden. "Examination of a Technique for the Early Detection of Failure in Gears by Signal Processing of the Time Domain Average of the Meshing Vibration." Commonwealth of Australia, 1986, ARL-AERO-PROP-TM-437.
- AD-A182 572, P.D. McFadden. "Interpolation Techniques for the Time Domain Average of the Meshing Vibration Data with Application to Helicoptor Gearbox Monitoring." Commonwealth of Australia, 1986, ARL-AERO-PROP-TM-437.
- AD-A173 851, P.D. McFadden. "Analysis of the Vibration of the Input Bevel Pinion in Ran Wessex Helicoptor Main Rotor Gearbox WAK 143 Prior to Failure." Commonwealth of Australia, 1985, ARL-AERO-PROP-R-169.
- AD-A155 199, P.D. McFadden. "Proposal for Modifications to the Wessex Helicoptor Main Rotor Gearbox Vibration Monitoring Program." Commonwealth of Australia, 1985, ARL-AERO-PROP-TM-422.
- Hydraulic Institute Application Standards B-74-1, 1967.
- S2.5. American Standard Recommendations for Specifying the Performance of Vibration Machines.
- J. I. Taylor. "Identification of Bearing Defects by Spectral Analysis." ASME Publication 79-DET-14, 1979.
- Harvey L. Balderston. "The Detection of Incipient failure in Bearings." Materials Evaluation, Vol. 27, No. 6, June 1969, pp. 121-128.
- De Jongh, Frits M., and van der Hoeven, Pieter, "Aoolication of a Heat Barrier Sleeve to Prevent Syncronous Rotor Instability," Proceedings of the Twenty-Seventh Turbomachinery Symposium, Texas A & M University, College Station (September 1998).
- American Petroleum Institute, Tutorial on the API Standard Paragrapghs Covering Rotor Dynamics and Balancing: An Introduction to Laterral Critical and Train Torsional Analysis and Rotor Balancing, API publication 684(Washington, D.C.: American Petroleum Institute, 1996).
- Muszynska, A, "One Lateral Mode Isotropic Rotor Reponse to Nonsyncronous Excitation," Proceedings of the Course on the Rotor Dynamics and Vibration in Turbomachinery, von Karman Institute for Fluid Dynamics, Belgium (September 1992).
- Machinary Lubrication 5/2005
- http://www.mechanicalengineeringblog.com/tag/looseness/
- http://www.update-intl.com/VibrationBook13b.htm
- http://www.machinediagnostics.com/PDF/Vibration/VibrationGuide.pdf
- http://http//:www.mech.uq.edu.au/courses/mech7350/lecture-notes-in-pdf/mech7350-17-fault-diagnosis.pdf
- http://www.vtab.se/training/vibration-school/mechanical-looseness/?lang=en
- http://www.vibanalysis.co.uk/vibanalysis/looseness/looseness.html